Amytis allows you to bring multiple data sources together into a single workspace, and conduct in depth analysis and interpretations on them.

Freddie Starkey
Co-founder & CEO

Scientific projects involve many sources of information, from papers and experimental data, to genetic and protein sequences. Amytis allows you to bring all of these data sources together into a single workspace, and conduct in depth analysis and interpretations on them.
Understand different data types in Amytis
Within Amytis, there are lots of different data types that can be incorporated into a workflow:
Sequence data: DNA, RNA and Protein sequence nodes exist to hold sequence data. FASTA and GenBank files will appear as File notes, but will be recognised as holding sequence data.
Spreadsheets: CSV, TSV and Excel files become Data nodes with table views for inspection, filtering and creating downstream subsets.
Files: PDFs and documents can be indexed, queried or connected to analysis tools.
You can input these different data types by dragging them straight into the canvas workspace, or by using the Database, Journal and WebQuery nodes to conduct a new search for data.
The Database and Journal nodes allow you to search through scientific databases and journals using natural language prompts. Supported sources include NCBI for genes, proteins and nucleotide records; UniProt for protein information; Ensembl for genes and genomes; PDB for molecular structures; STRING for protein interactions; KEGG for pathways; PubChem for chemical compounds; GEO for gene-expression studies; and BioNumbers for quantitative biological measurements. PubMed and PMC extend the workflow into biomedical literature.
More information on the Database and Journal nodes can be found here.
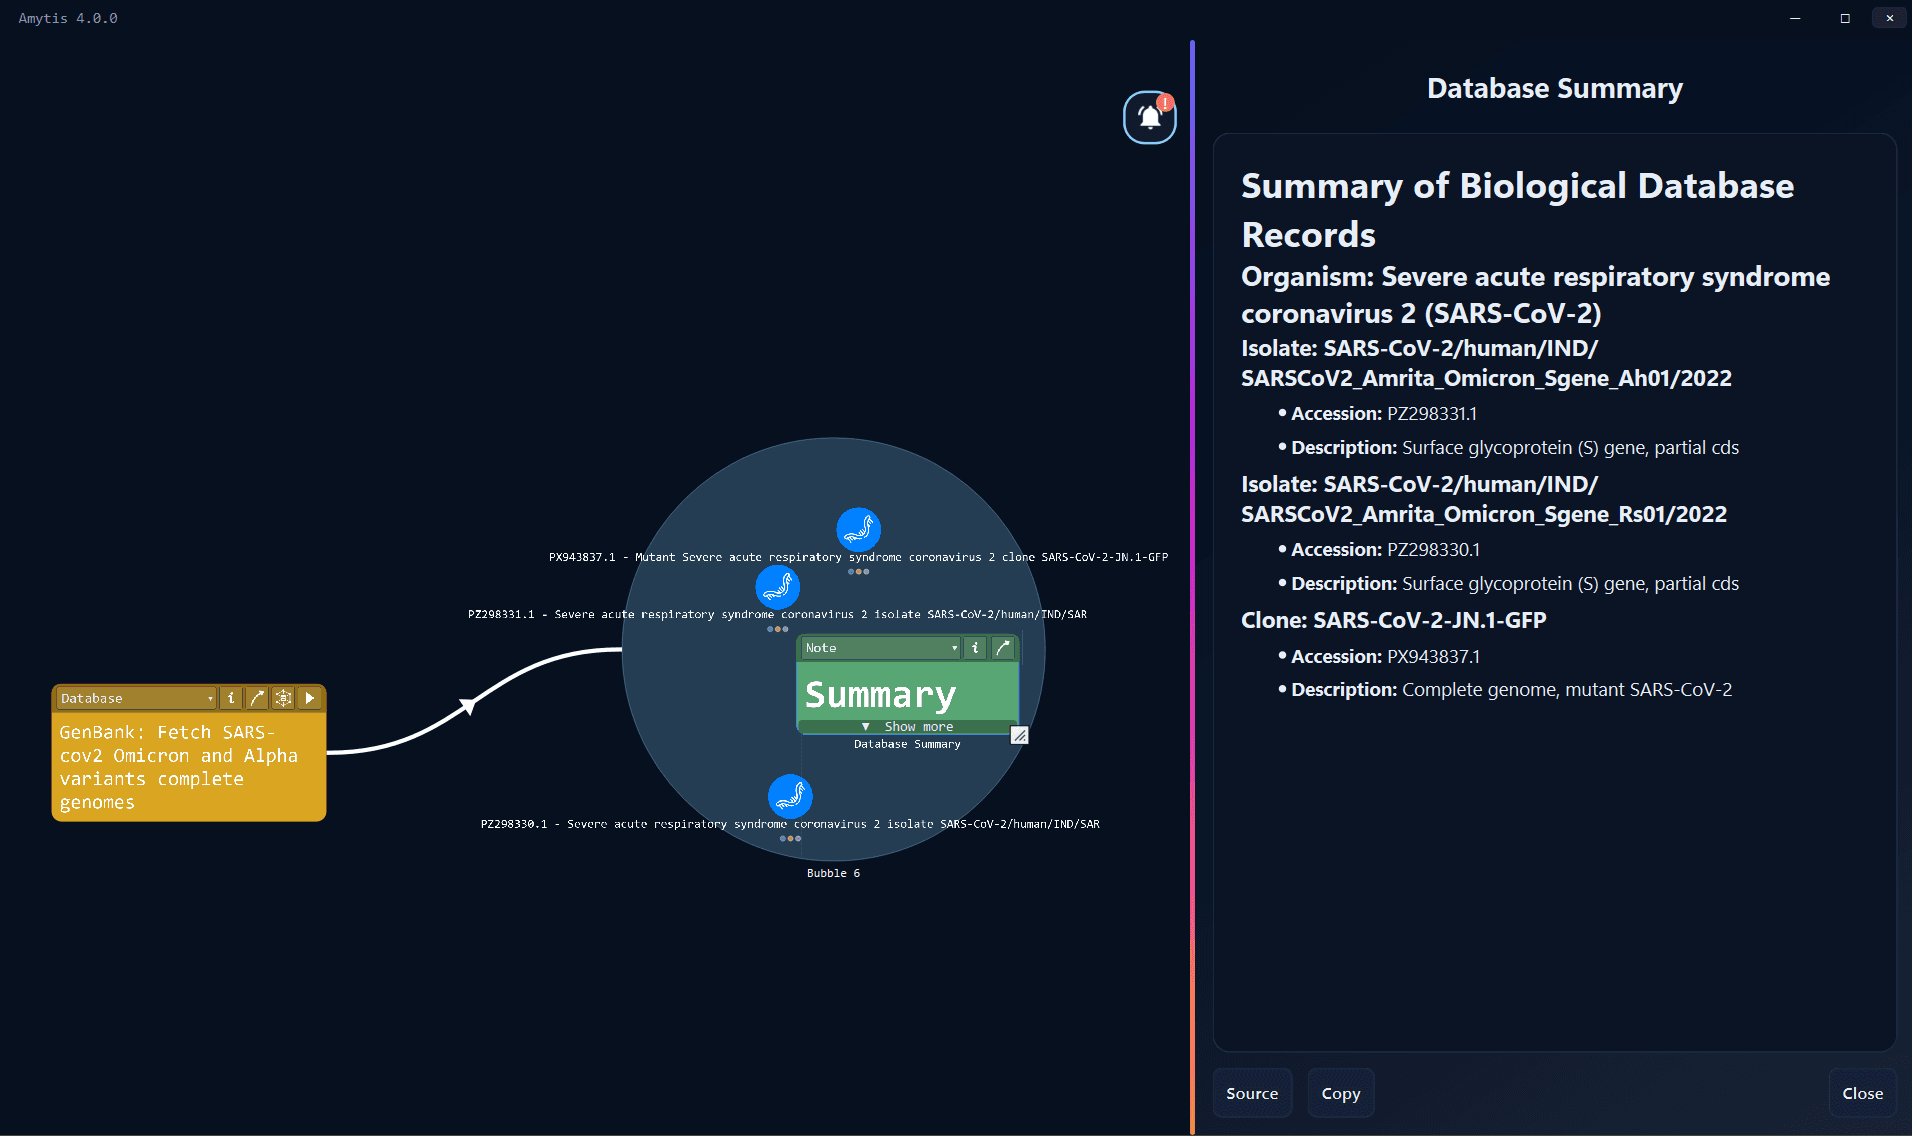
For material outside specialist databases, Web Query searches the open web, while LIMS Query applies a similar natural-language interface to laboratory inventory, samples, equipment and protocols.
Data visualisation with Python and R
The built-in Python and R Factory nodes allow you to generate and run scripts within Amytis. Find out more about how to use them here.
Inspect sequence data
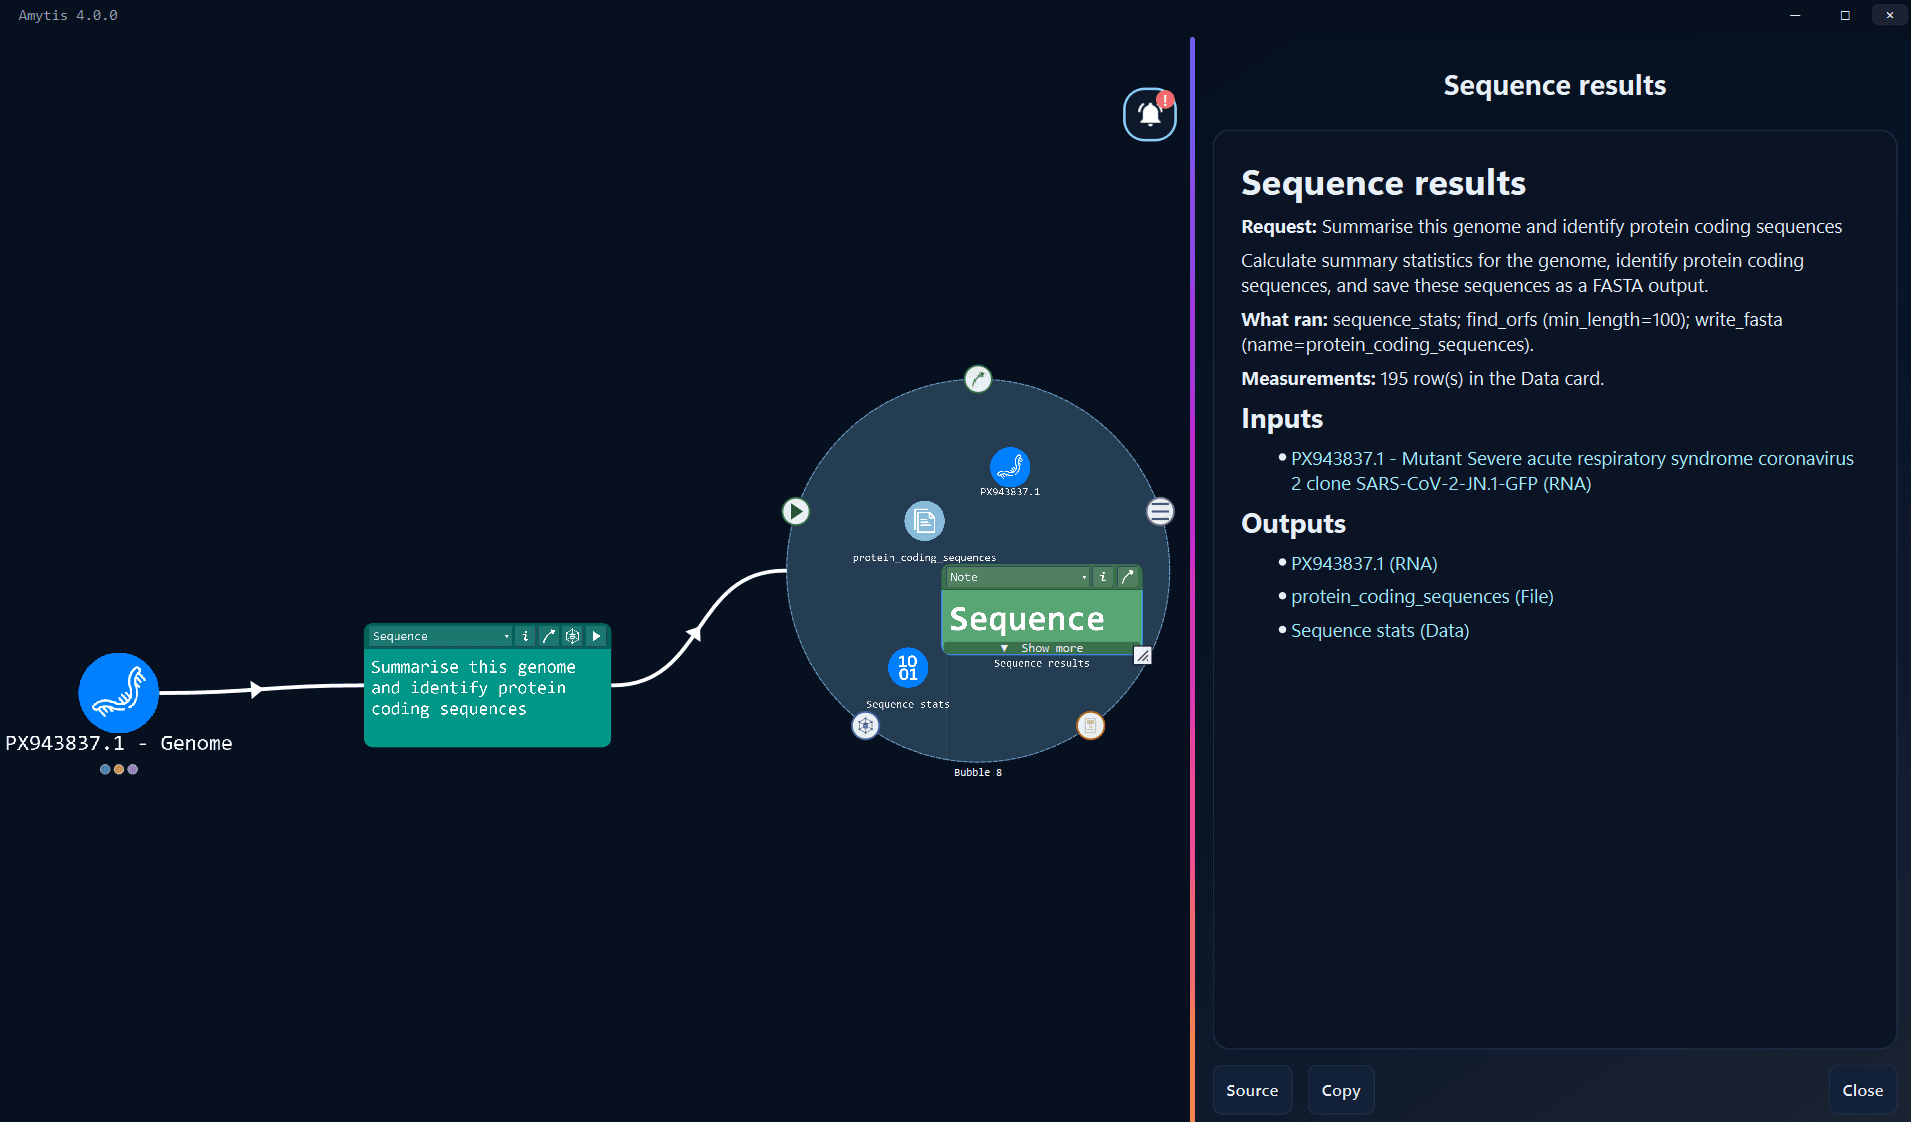
Sequence data (RNA, DNA and Protein sequences) can be inspected and analysed using the Sequence node. You can create a new RNA, DNA or Protein sequence node by dragging it from the top menu bar, or you can drag and drop your own sequence data into the canvas and Amytis will automatically pick it up as sequence data.

The Sequence node can conduct operations including slicing, motif analysis, translation, ORF detection, restriction analysis, assembly, alignment, BLAST and primer workflows. Derived sequences and statistics return to the canvas as new nodes, preserving the relationship between the original biological material and subsequent analysis.
Synthesise different data types into a single workflow
The graphical nature of Amytis allows you to run specific visualisations and interpretations for each dataset, before combining these into larger interpretations. Connecting individual data interpretations to a Prompt card will allow you to synthesise and summarise multi-data sets.
Get started